Introduction
The National Basketball Association (NBA) is a professional men’s basketball league in North America, made up of thirty teams(29 within the U.S. and one in Canada). It is considered one of the four major professional sports leagues within the USA and Canada.
The league was founded in New York City on June 6, 1946, as the Basketball Association of America (BAA). It changed its name to the National Basketball Association on August 3, 1949, after merging with the competing National Basketball League(NBL). The NBA’s regular season runs from October to April, with each team playing 82 games. Its playoffs extend into June.
Data Collection
Through a zip file found on a Carnegie Mellon webpage (http://www.cs.cmu.edu/~tom/10601_sp09/project.html), which has data on every professional NBA player since 1946 through 2005, I was able to make inferences on the coherency that an NBA athlete’s performance in the regular season, has with their performance in the postseason (playoffs). Because of many rule changes that have occurred through the years, I am only looking at players that played starting in 1985.
Preprocessing
Since I was looking for statistics for a player’s career in the regular season and playoffs, I only used two csv files from the zip file as they best represented what I was looking for. When viewing the data for the first time, there were many attributes about a player that were represented, but not needed. As we were only viewing their statistics, all their personal information, from there name to thier age and the number of years played in the league, were unnecessary and removed. I then merged the two files so I can see each player’s regular season and playoffs statistics on the same file; this also helped in removing any player that did not ever play in the playoffs.
Data Analysis
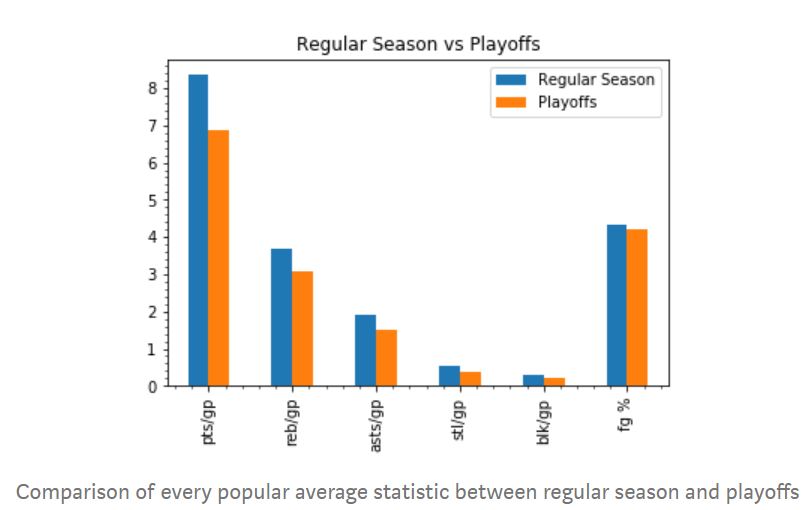
The graph above indicates that on average, a player’s performance will decline in every statistical category shown. This could be because of many reasons such that every team that makes the playoffs are ranked in the top half of the NBA, and the teams that meet, will have at least four games to compete with one another. This gives each team a chance to strategize against their opponent and allows them to take their strengths away and expose their weaknesses. This evidently hinders a player’s performance to not be as good as it was in the regular season where there was a random team every day with varying skill levels.
Given these reasons, it would seem like it would be fairer to compare the standard of play of each individual player throughout their career.
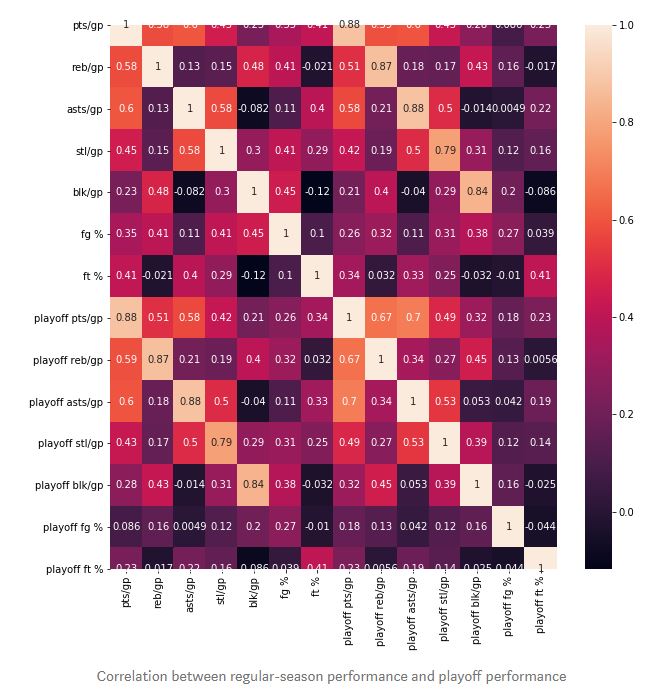
The heat map above clearly shows that in most of the statistical categories, the performance of a player in the regular season has a positive correlation to their performance in the playoffs. However, the field goal % and free throw % do not have a significant correlation probably due to a few outliers.
The reason why the field goal % has more outliers than the other fields is because every player plays in the regular season but some of those players were rarely ever in the playoffs. For example, if a player only played one game in the playoffs ever, and he took one shot and made it, then his field goal % will be 100% which is realistically impossible to achieve for any consistent player.
To get rid of these outliers, the players who barely have any experience in the playoffs must be filtered out.
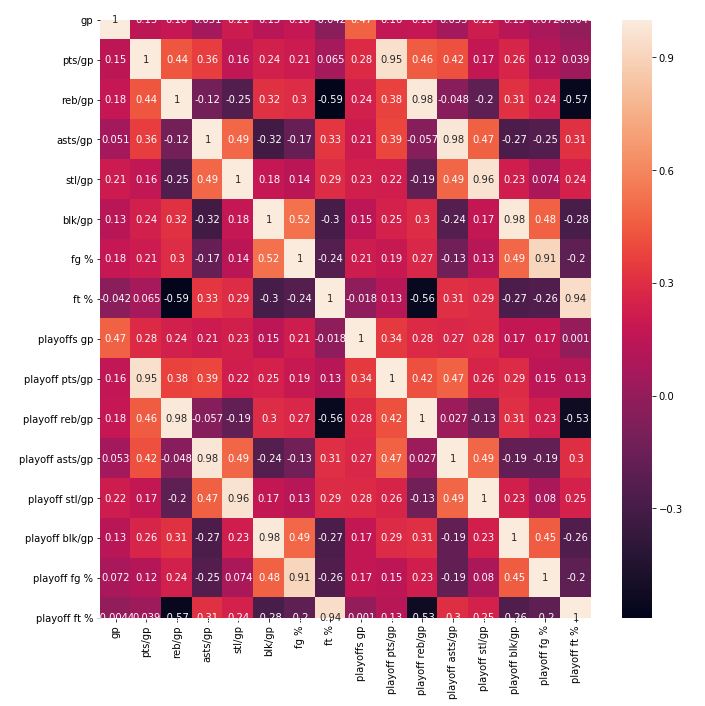
The heatmap only takes into account players who played at least a hundred playoff games throughout their career meaning they have more experience. Evidently the correlation in every statistic is much stronger than it was in the previous heatmap most notably in FG %.
From these observations, I believe it is safe to assume that the players who perform consistently well in the regular season and at the same time, have more experience in the playoffs, their impact on the court does not change significantly, although their specific stats will decrease.
To see the methods used to analyze the data, click here.